english learners
English Learners Face a Big Challenge and It Impacts Test Scores
In May of 2021, the Santa Clara County Board of Education voted 6-1 to reprimand Bullis Charter School for what it described as a chronic failure to proportionately enroll low-income students, Latino students and children with disabilities. How is BCS doing in meeting the board’s mandate for change? Our latest research shows that BCS has made little or no progress toward the goal of equality. You can read our latest report on BCS enrollment here.
There are a variety of factors that influence academic test scores. One critical factor is the number of languages and number of students who are English Learners at a school. Please see our letter to the SCCOE Board on the under enrollment of English Learners at BCS.
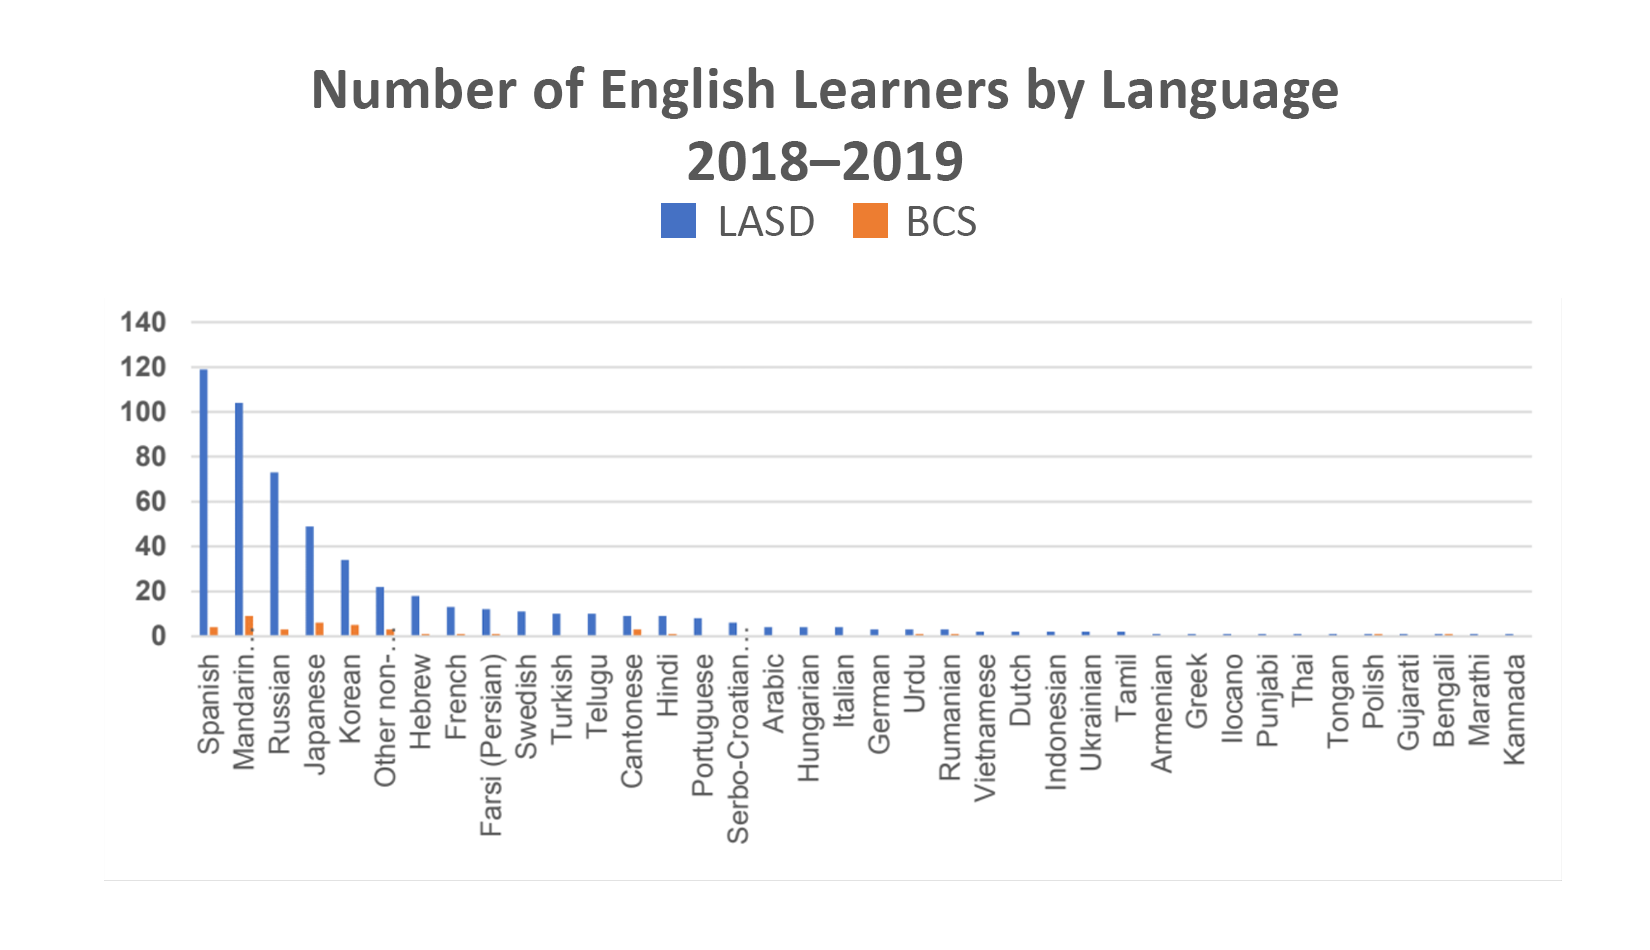
Data from the independent, public, California Board of Education (CBE) indicate that students identified as English Learners score lower on test scores, as shown in the two charts below.
(*Note: Click on the charts and graphs below to enlarge them.)
California Smarter Balanced CAASPP scores are for 2018
Source
The CBE data indicate that LASD schools and Bullis Charter School are both responding to their respective English Learner students. However, the data also shows that the number of English Learner students, and the number of native languages, is proportionately far greater in LASD schools than in BSC. LASD’s challenge is to help 13% (549 students) of their student population develop English proficiency from 38 native languages. BCS’s challenge is help 4% (41 students) of their student population develop English proficiency from 15 native languages.
This is a significant challenge for all of the students, for all of the teachers and for all of the families served by each of these schools. It is an even bigger challenge for each English Learner student.
Fortunately, the data indicate that, overall, the rate of success for all of our schools is impressive.
Generally, at six of our schools (Gardner Bullis, Springer, BCS, Loyola, Covington and Oak) 50% or more of the prior year English Learners are reclassified to fluent English proficient. These six schools have lower percent (5% to 15%, with a rough average of 10%) of English Learners in their total enrollment
There are two schools (Santa Rita and Almond) who have the largest number (185 & 115), and largest proportion (34% and 21%) of the total enrollment who are English Leaners. Most of these are native Spanish speakers. The reclassification ratios for these two groups ranges from the high teens (19%) into the thirties (31% to 37%). 19% to 37% is a much lower reclassification than 50% or more, in our other schools.
The Santa Rita and Almond are neighborhood schools that have a disproportionately large challenge. At this point, we do not know if 19% to 37% reclassification ratio with a 34% to 21% concentration is above, at or below the norm for other neighborhood schools in the surrounding area.
This is a clear opportunity to “increase learning opportunities for all pupils, with special emphasis on expanded learning experiences for pupils who are identified as academically low achieving”. This is a very clear, charter school goal, straight out of the California Charter School Act (Charter Development Process: 47605 - Required Charter Elements (7)).
An important question is, after fifteen years of close physical proximity to both Santa Rita and Almond and the neighborhoods they serve, why BCS has not been successful in attracting and serving more of these native Spanish speaking English Learner students.
The data indicates BCS is only serving four native Spanish speaking English Learners. If BCS were serving the LASD average, there would be approximately twenty-five Spanish speaking English Learners at the school. If BCS were serving the adjacent Almond and Santa Rita averages, there would be approximately one hundred Spanish speaking English Learners.
For a decade and a half, the opportunity for the BCS Board fulfill the promise of the Charter School Act, to “increase learning opportunities for all pupils, with special emphasis on expanded learning experiences for pupils who are identified as academically low achieving,” has been right there. How did it get away?
Our understanding is the CBE has established data collection standards that result in all students being classified into one of four categories. As the students’ academic career progresses, there is, if appropriate, an annual updating of the classifications. The table and graphs below provide an indication of the composition of the enrollments and the ratio of prior year English Learners who are reclassified into fluent English proficient.
English Learner - English Language Acquisition Status (ELAS)
Source
EO Enrollment of students with English Only (EO)
IFEP Enrollment of students with Initial Fluent English Proficient (IFEP)
EL Enrollment of students with English Learners (EL)
RFEP Enrollment of students Reclassified Fluent English Proficient (RFEP)
Total Enrollment = EO + IFEP + EL + RFEP
EL to RFEP then IFEP Progression: Student initially coded an EL, reclassified into RFEP when appropriate, then added to IFEP


